- Aldo Ciau-Uitz
- Chenfu Shi
- Iris Valent
- Jack M Monahan
- Jinfeng Chen
- Julia Vivian
- Minna Taipale
- Páidí Creed
- Paula Golder
- Paula Kokko-Gonzales
- Rafael Tavares
- Shankar Balasubramanian
- Walraj S. Gosal
A body of evidence indicates that epigenetic modifications in DNA comprises a fundamental pathway by which genes can be silenced or activated, determining cell fate and function. In mammalian genomes, the fifth carbon of cytosine is one major target for epigenetic modification (Figure 1). Currently, reading the two most prominent modifications 5-methylcytosine (5mC) and 5-hydroxymethylcytosine (5hmC), simultaneously at high resolution remains largely elusive at the single cell level, making the function and relationship between these modifications difficult to precisely ascertain. Here we present a single nuclei workflow, enabled by barcoding with Tn5, to simultaneously determine 5mC and 5hmC at the single molecule level (Figure 2).

Figure 1 | Cytosine modifications at the fifth carbon is a major target of epigenetic modification in mammalian genomes.
5‑methylcytosine (5mC) is associated with gene silencing and patterns of this modification are altered in diseases such as cancer. In contrast, 5‑hydroxymethylcytosine (5hmC) has only recently been suggested to play a role in gene regulation and is generally considered a marker of active tissue-specific genes and enhancers.
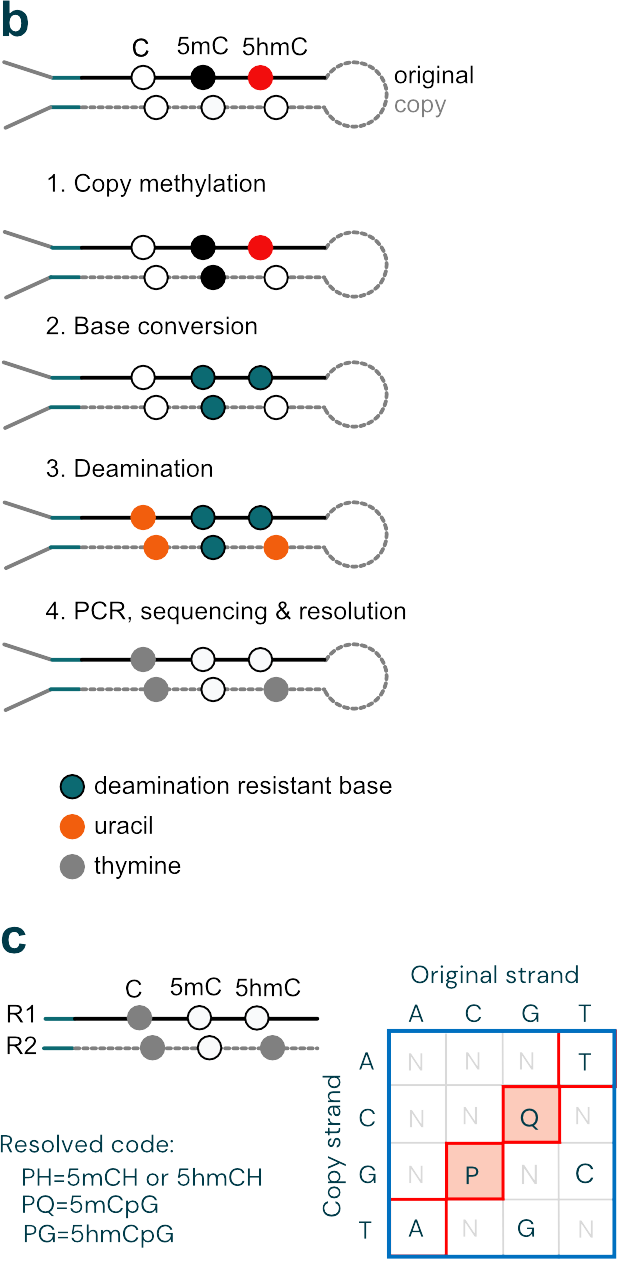
Method summary
Strand synthesis: creates a single molecule original strand tethered to a copy via a hairpin. A high fidelity methyltransferase is used to copy over 5mC.
Sequencing: generates sequence information after protection of cytosine modifications and deamination of remaining cytosines (read as thymine in NGS).
Read resolution: uses base call information from both strands to correctly call all 4 canonical bases along with 5mC and 5hmC.
Alignment: results in aligned 4-base reads with 5mC & 5hmC as tagged information (6 base information)
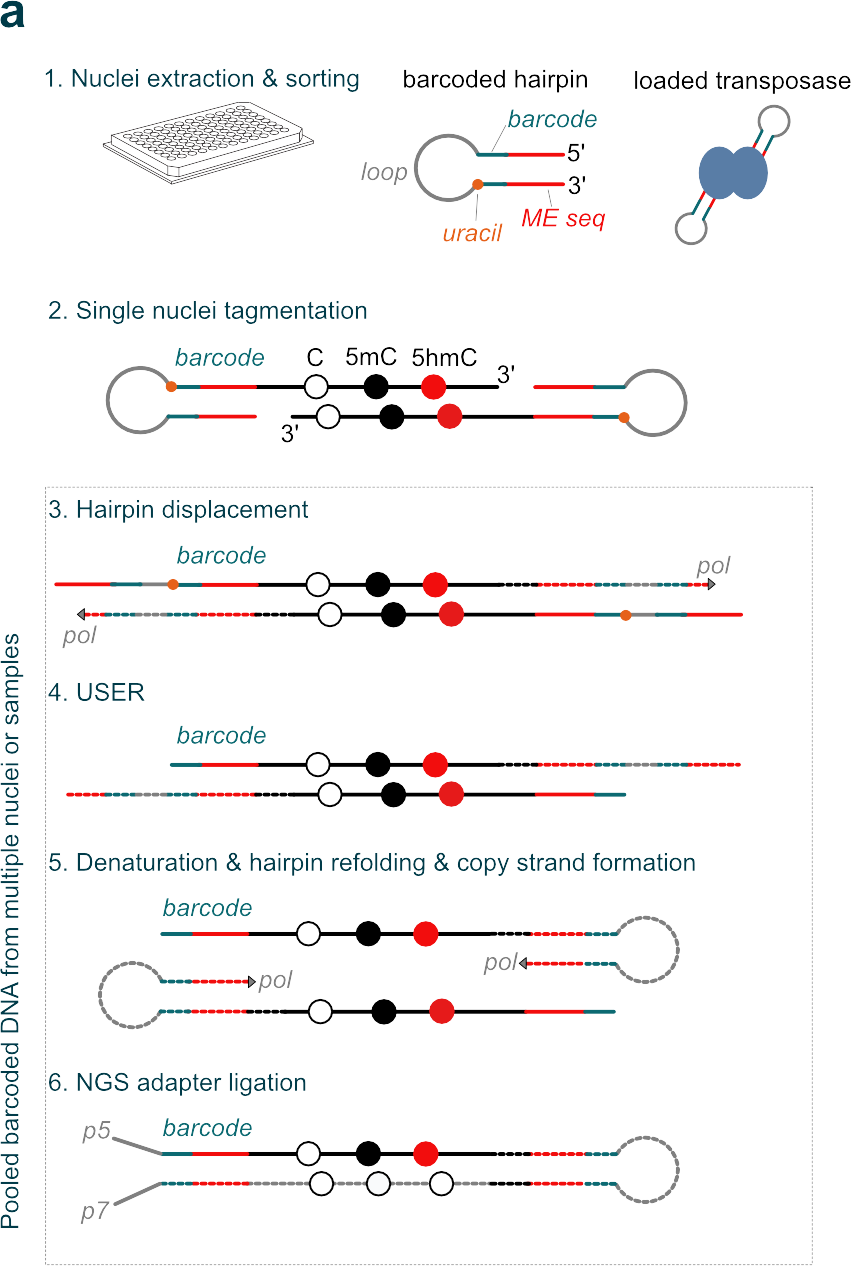
- Nuclei sorted into wells are tagmented after nucleosomal disruption using Tn5 loaded with a hairpin containing a cell-specific barcode, and DNA from multiple nuclei is pooled. A duet library is constructed using steps 3-6.
- 5mC and 5hmC can be determined using enzymatic conversion¹. Barcoded duet libraries undergo copy methylation only at 5mC (using DNMT5), base conversion (using TET) and deamination (using the ssDNA deaminase A3A and the UvrD helicase).
- Reads from paired-end NGS are resolved using a lookup table into a single 4-base read with annotated 5mC and 5hmC base calls.
A body of evidence indicates that epigenetic modifications in DNA comprises a fundamental pathway by which genes can be silenced or activated, determining cell fate and function. In mammalian genomes, the fifth carbon of cytosine is one major target for epigenetic modification (Figure 1). Currently, reading the two most prominent modifications 5-methylcytosine (5mC) and 5-hydroxymethylcytosine (5hmC), simultaneously at high resolution remains largely elusive at the single cell level, making the function and relationship between these modifications difficult to precisely ascertain. Here we present a single nuclei workflow, enabled by barcoding with Tn5, to simultaneously determine 5mC and 5hmC at the single molecule level (Figure 2).
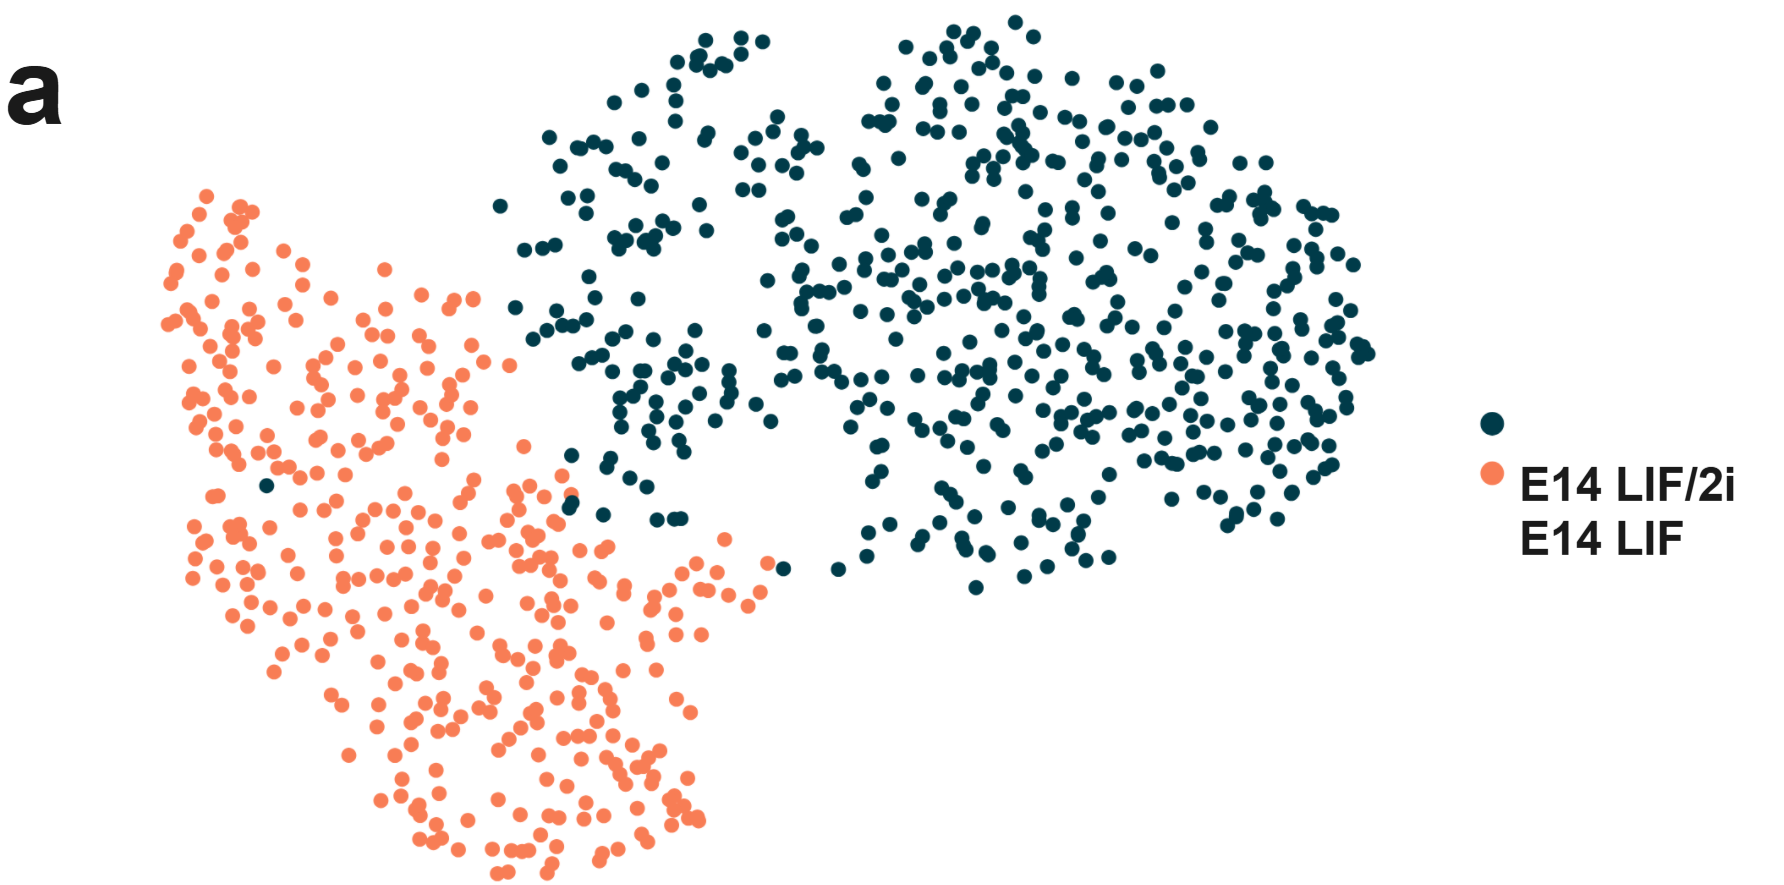
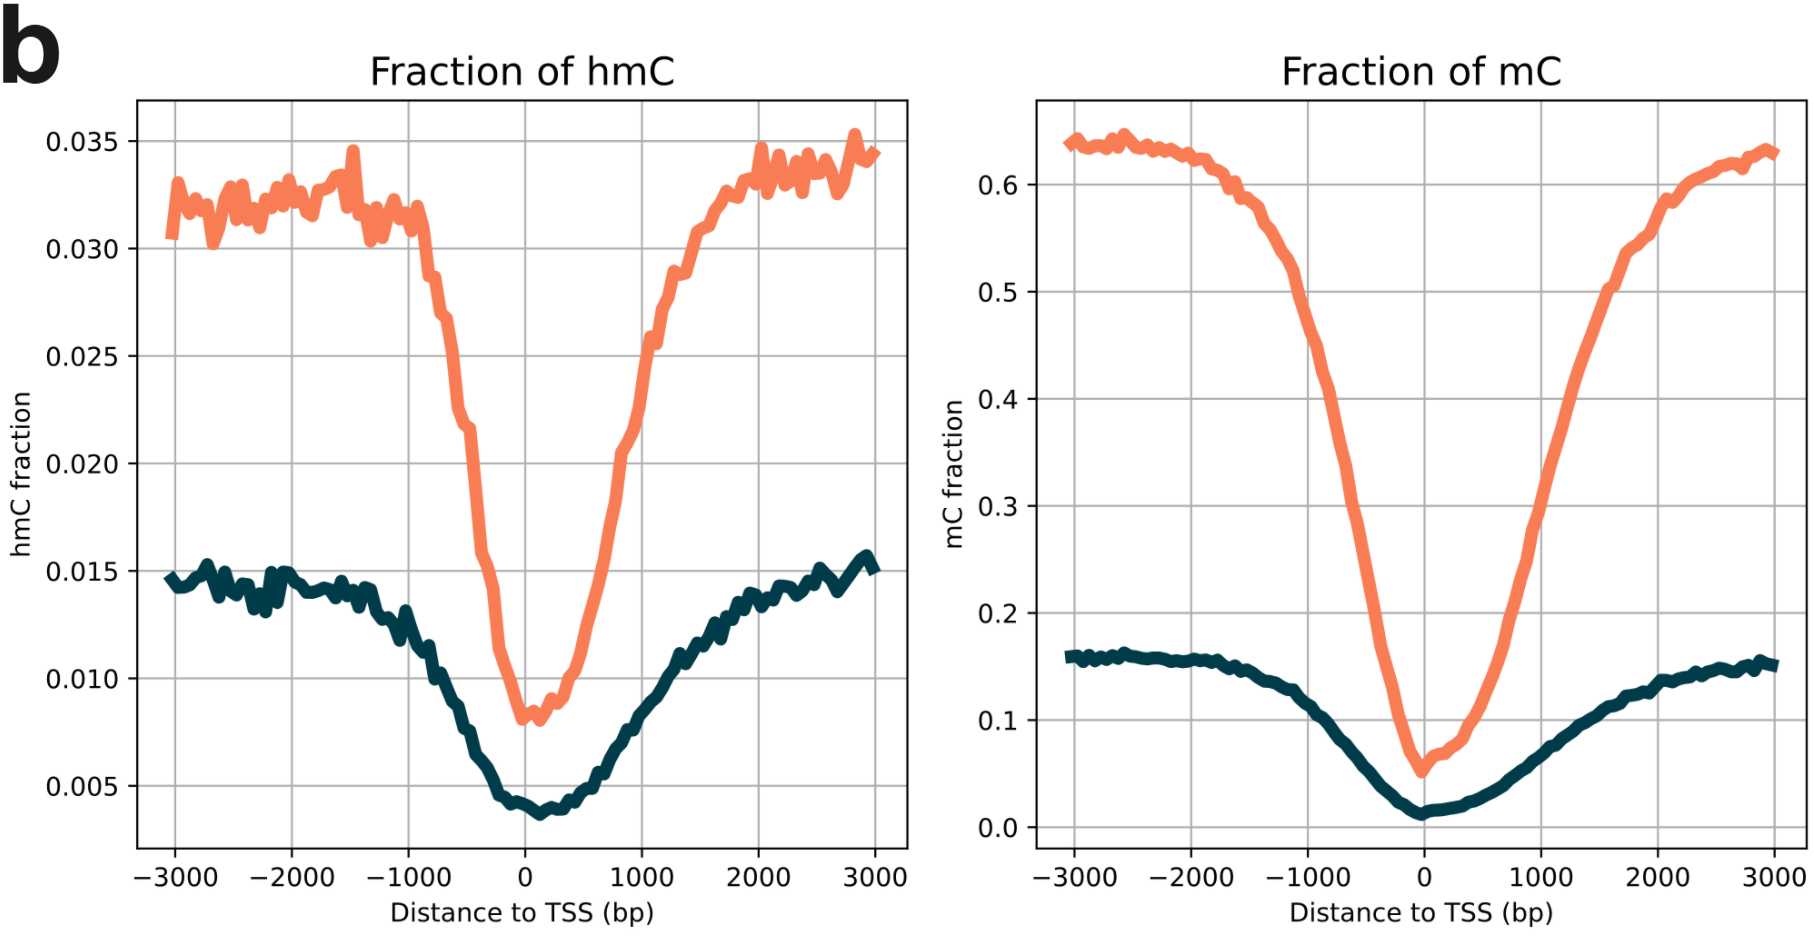
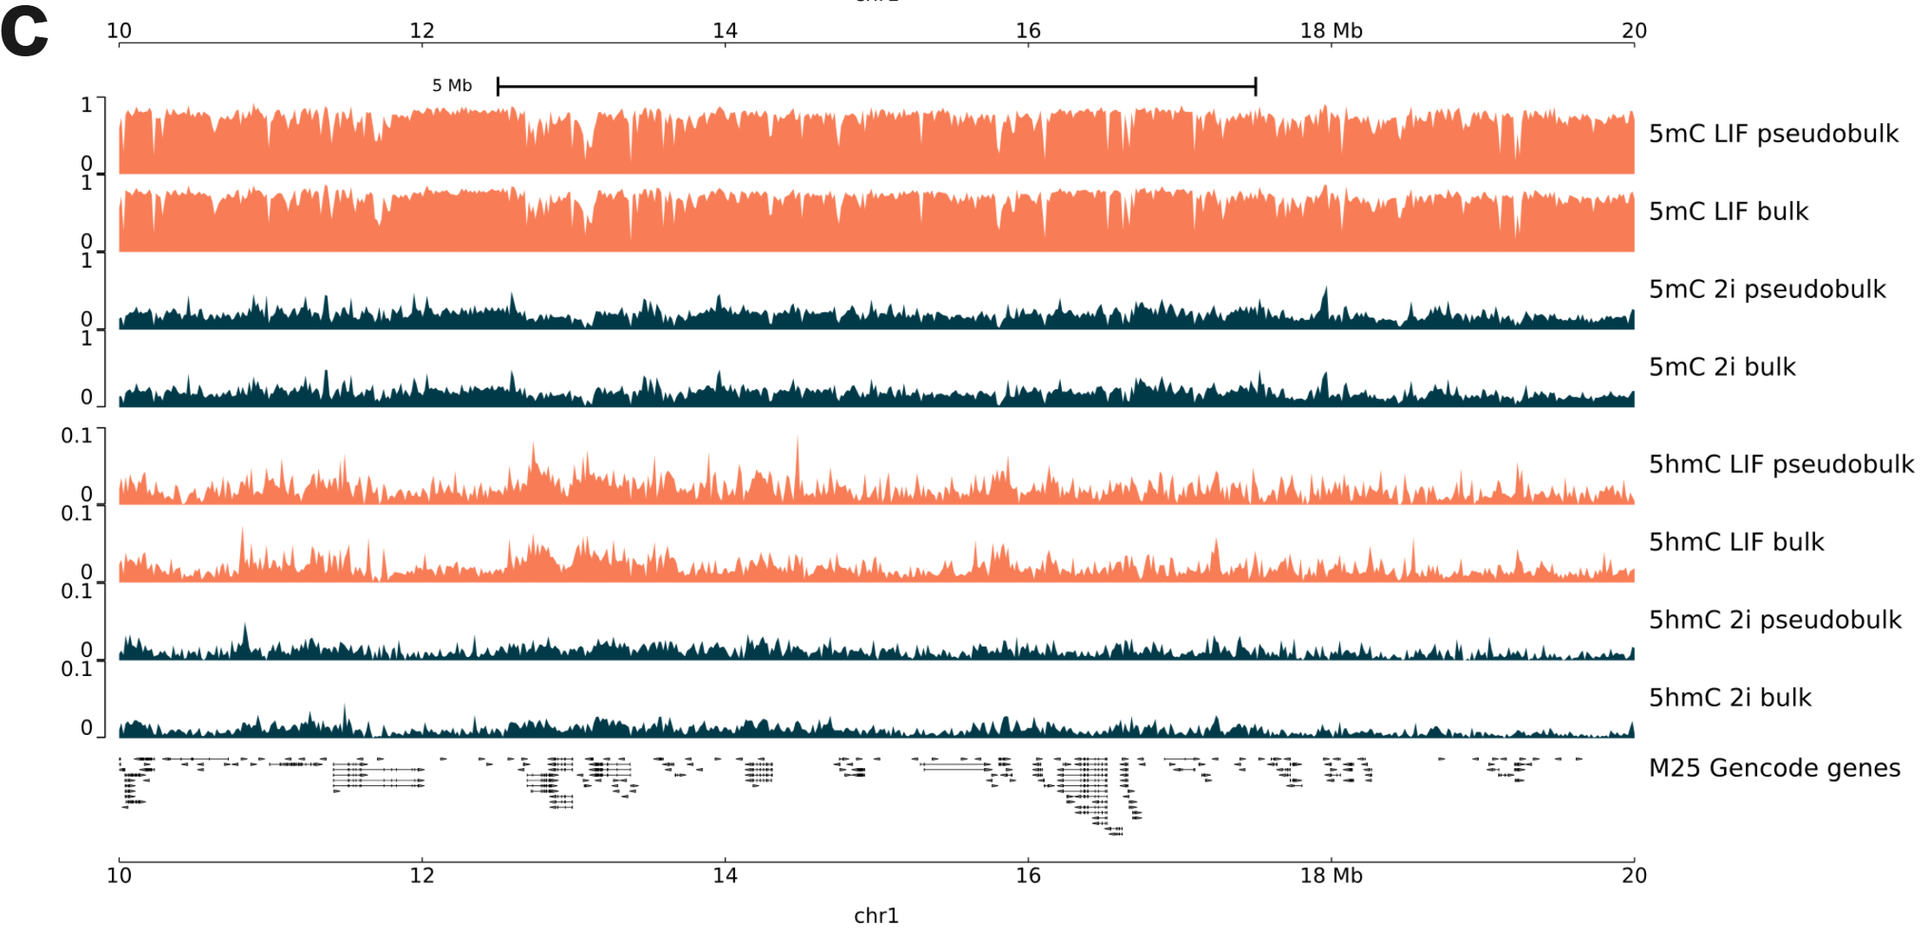
- Clustering demonstrates two distinct populations (LIF orange & LIF/2i in blue).
- 5hmC and 5mC signal around TSS from each cluster (LIF orange & LIF/2i in blue).
- Genome view of 5mC and 5hmC base calls from single cell clusters and bulk sequencing (LIF orange & LIF/2i in blue). Genome level data reveals one cluster can be assigned to cells grown with LIF and the other to LIF/2i.
To demonstrate that duet evoC is able to read single cell cytosine modifications, we applied the method to mouse embryonic stem cells, E14, grown under two different conditions (Figure 3). These conditions affect cytosine modifications. We show the method can produce a multimodal UMAP based on 5hmC and 5mC, with two clusters as expected. The profile for 5mC and 5hmC from each pseudo-cluster matches bulk sequencing of cells grown under LIF and LIF/2i conditions.
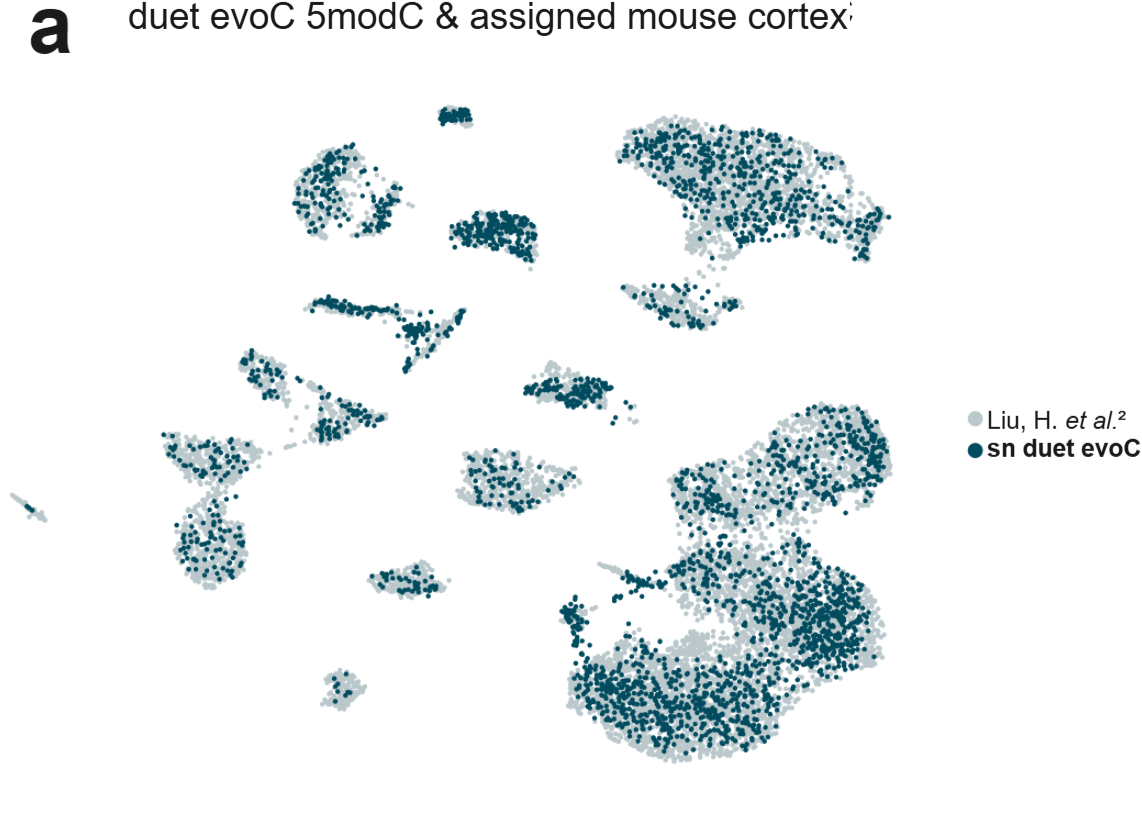
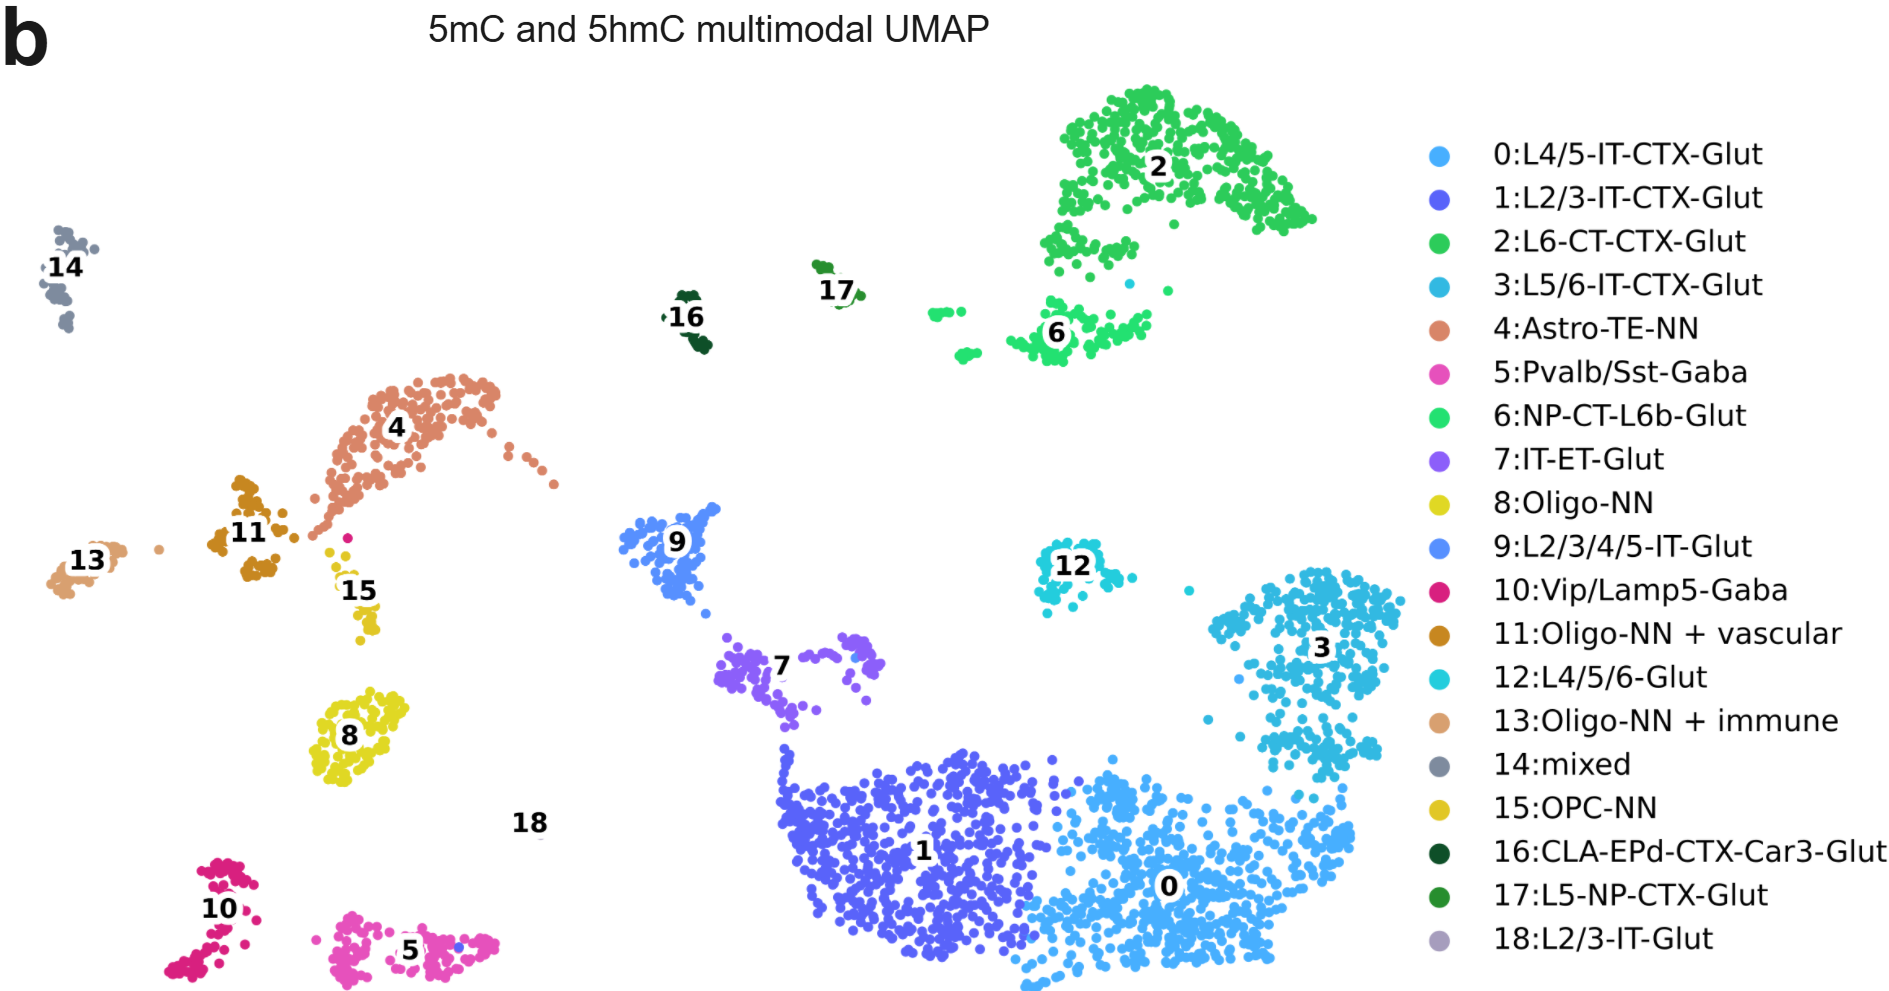

Figure 4 | Single nuclei duet evoC applied to mouse cortex.
- A UMAP produced using the tool Harmony³ to jointly project single nuclei duet data (5modC) and publicly available single-cell bisulphite methylome atlas².
- A reprojected UMAP using duet evoC reading of 5mC and 5hmC of the mouse cortex with annotated cell types.
- UMAP showing neuronal and non-neuronal cell types and differences in global levels of 5mC and 5hmC in different cell types.
We applied single nuclei duet evoC to cells from mouse cortex. We first collapsed the 5mC and 5hmC into a joint signal (5modC) and integrated our data with a comprehensively annotated bisulphite atlas² using Harmony³ (Figure 4a) The cell type assignments were then transferred to duet 5mC and 5hmC data revealing 19 distinct clusters of cells, and the resulting UMAP is presented in Figure 4b. This represents the most complete map of both 5mC and 5hmC at single cell level of the mouse cortex to date. As a first validation that this UMAP represents known cell-type specific epigenetic information, we show that neuronal cells in this UMAP are particularly enriched in 5hmC as is expected from the literature (Figure 4c).
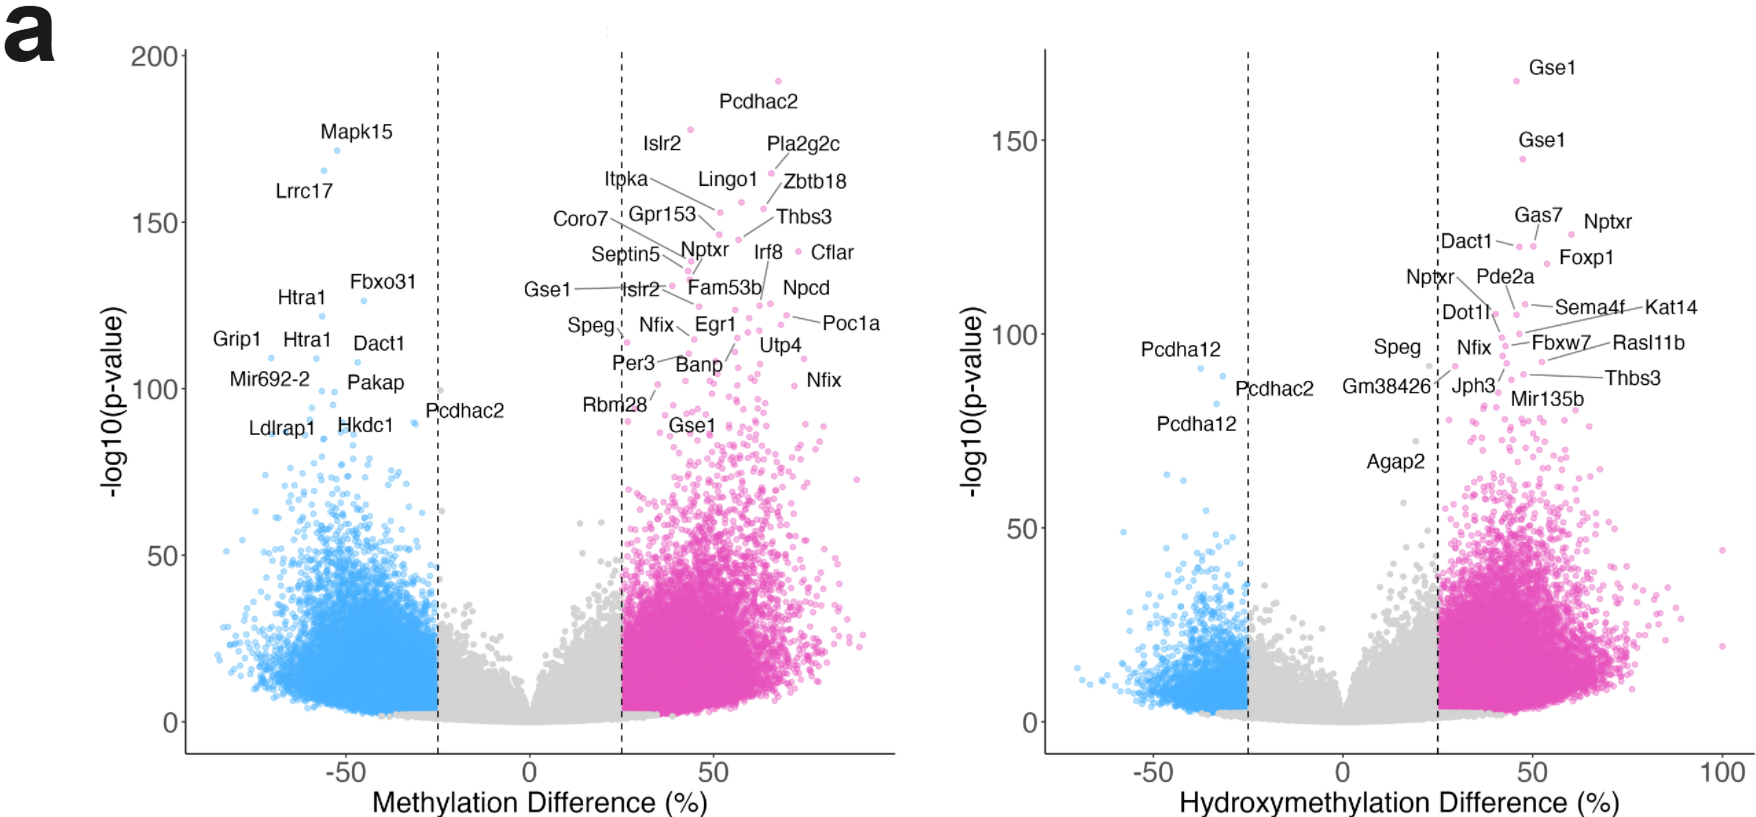
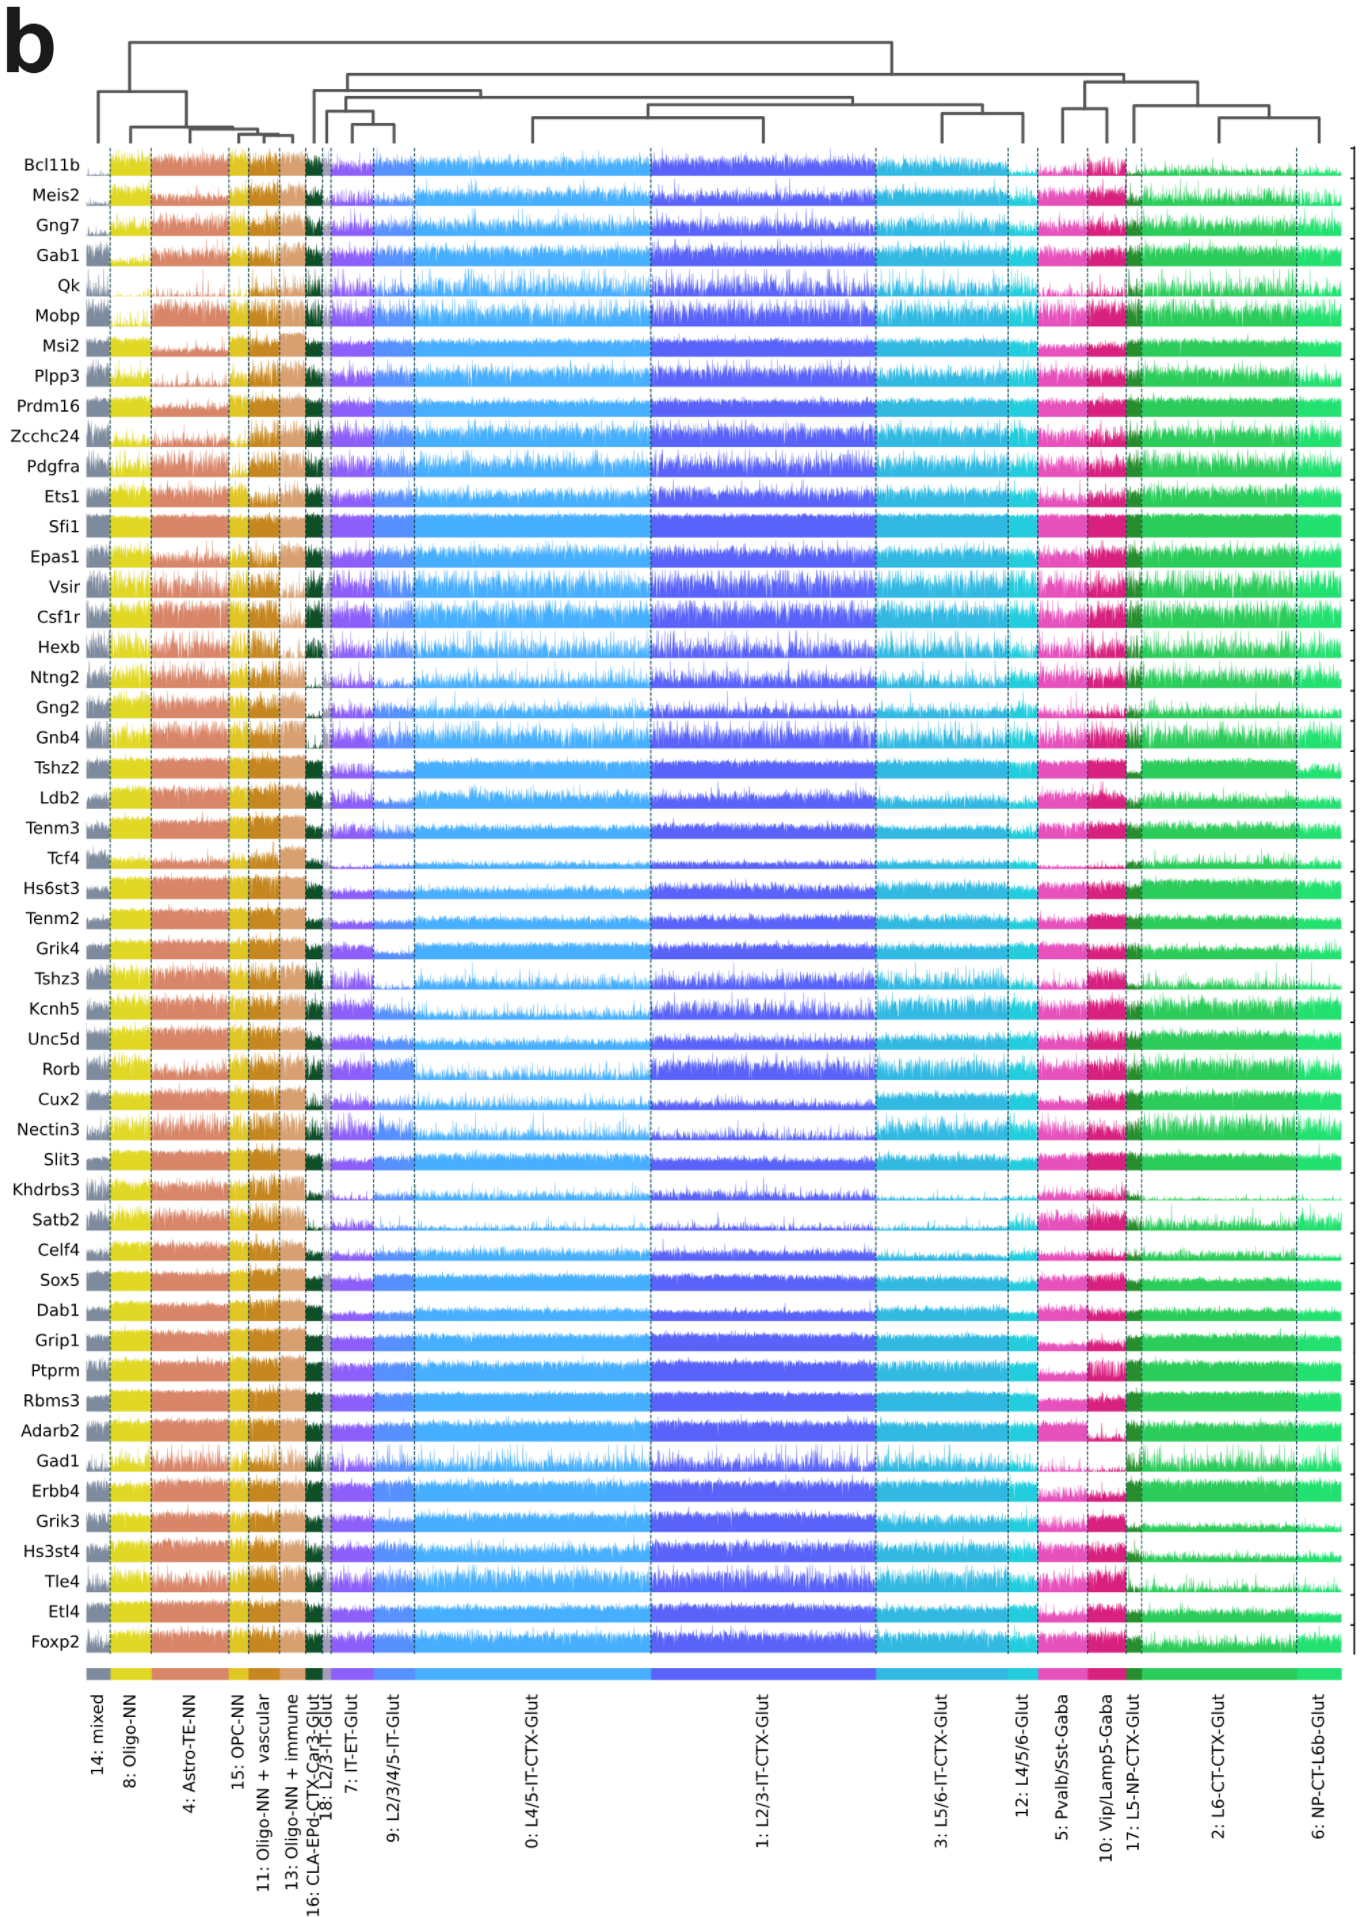
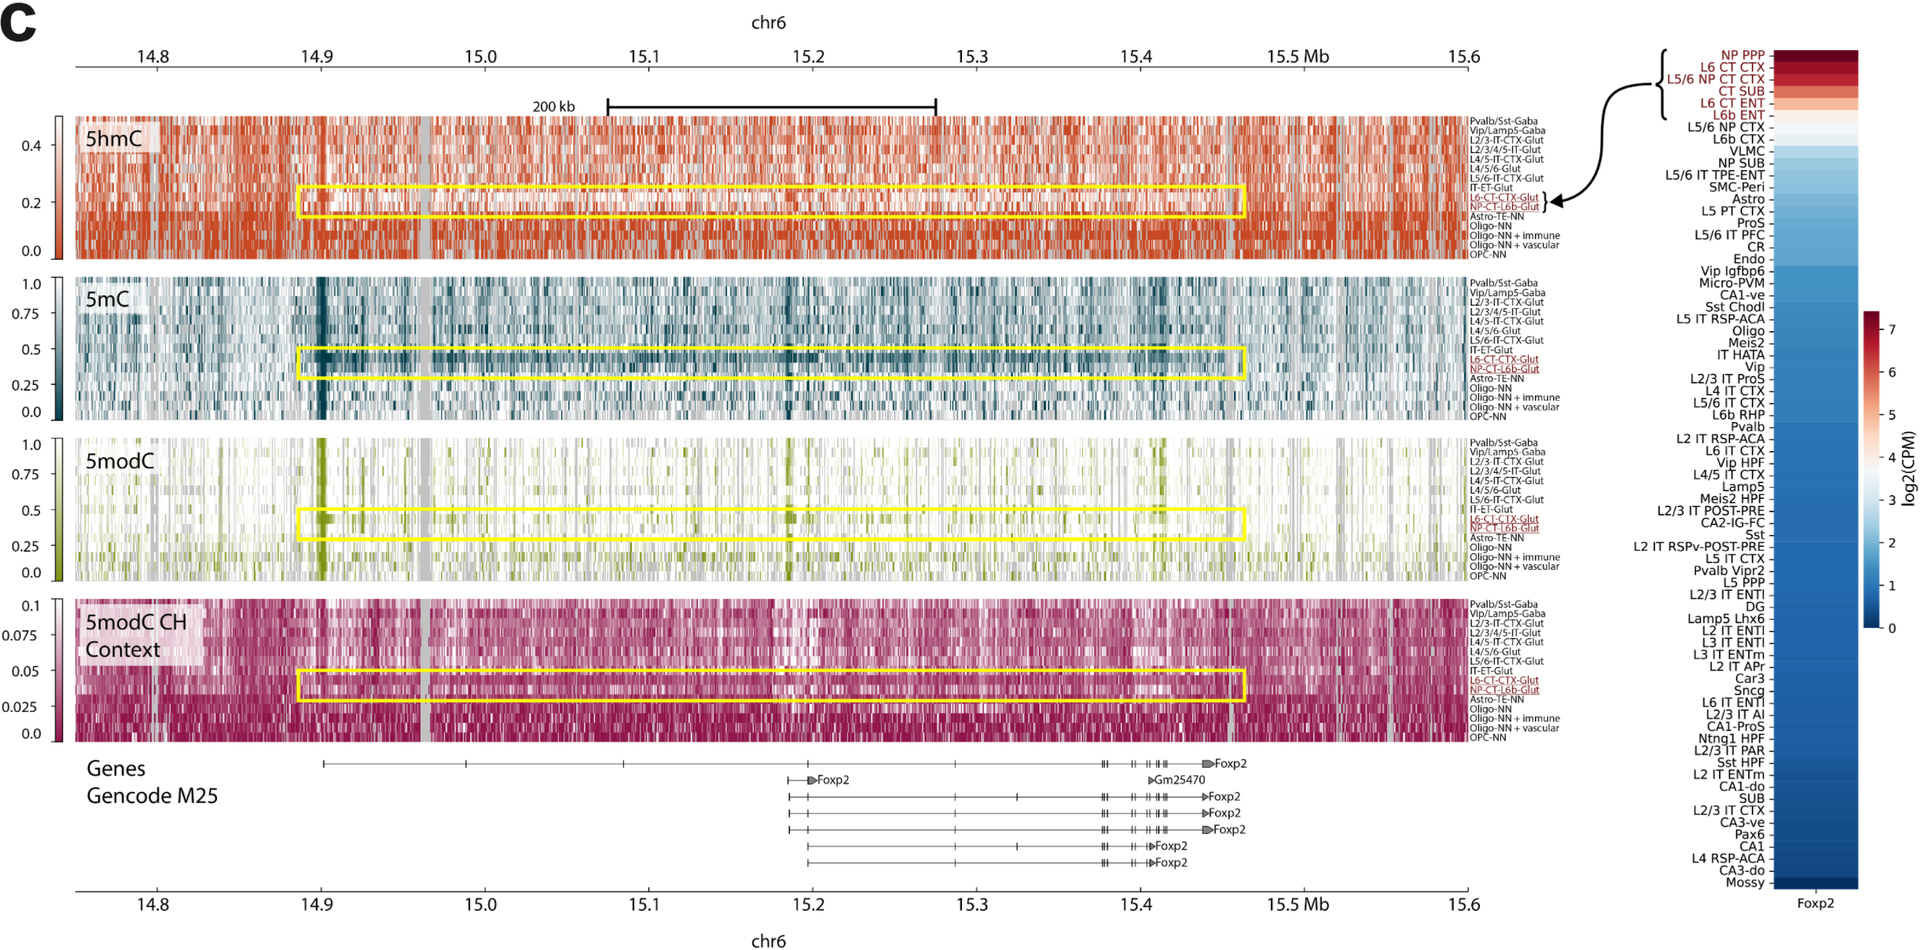
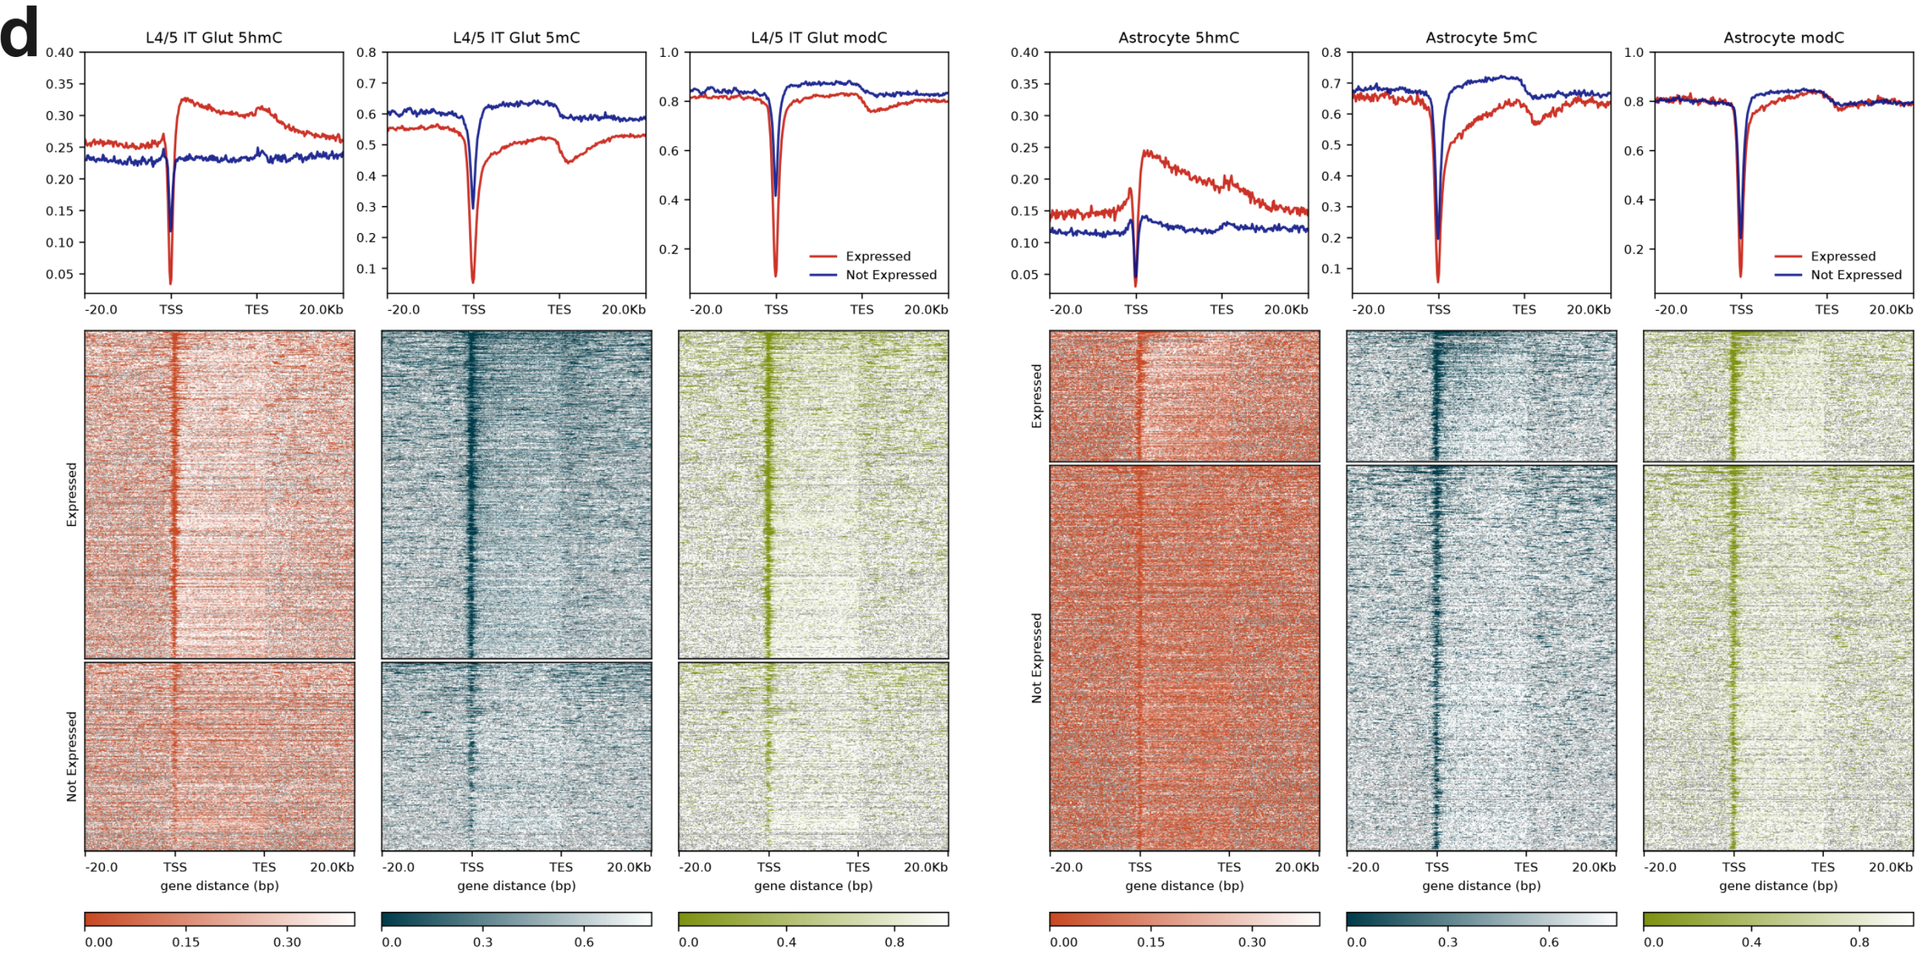
Figure 5 | Patterns of 5mC and 5hmC are unique to specific cell types.
- Example differential 5mC and 5hmC profiles for two different cell types.
- A line plot showing average 5mC pattern for some cell-type defining genes for each individual cell in each individual cluster.
- An example of the epigenetic profile across the Foxp2 gene along with companion expression data of this gene for different cell-types from single cell RNA-seq⁴.
- Gene body 5mC, 5hmC, and 5modC patterns for expressed and non-expressed genes.
Using our assigned UMAP containing the complete predominate cytosine modification profiles for each cell and cell type, we first show that a number of genes are differentially methylated or hydroxymethlated (Figure 5a), and certain genes have a pattern of hypomethylation across gene bodies that are cell-type specific (Figure 5b). To examine this in more detail, we highlight one gene from this dataset, Foxp2, which is highly expressed in certain glutamatergic neurons such as L6-CT-CTX-Glut and NP-CT-L6b-Glut (Figure 5c)⁴.
We show that for these cell types, there is a pattern of low 5mC (hypomethylation) and high levels of 5hmC (hyperhydroxymethylation) across the gene body for these two cell types in our dataset. However, this signal is attenuated when observed without discrimination for which cytosine modification is present (e.g. 5modC), due to the opposing effect of 5mC and 5hmC. 5modC in CH context is also less clear. To see if this is a global phenomenon in the mouse cortex, we examine patterns across expressed and non-expressed genes. Here, we find that indeed the pattern of reduced 5mC and increased levels of 5hmC are present at expressed genes for different cell types (both neuronal and non-neuronal cell types are shown above). The pattern of 5modC is again attenuated in comparison.
Here we present duet multiomics solution evoC – an enzymatic method that reads the four canonical bases in DNA together with complete epigenetic information encoded in DNA – as applied to single cells. Applying this method to nuclei isolated from mouse cortex we generate a UMAP for mouse cortex and looked at genome wide methylome and hydroxymethlome patterns across the genome for different cells types at a resolution not previously achieved, even by recent attempts⁵. We observe that cell-type specific genes are marked by low methylation and higher hydroxymethylation across the gene body. Since current methods using bisulphite often do not make the distinction between these two cytosine modifications, dynamic changes in cell-specific genes are radically reduced by a combined 5modC signal. This demonstrates the power of reading all six bases as a new lens to examine the dynamic information encoded in DNA.
- Simultaneous sequencing of genetic and epigenetic bases in DNA, Füllgrabe and Gosal et al., Nature Biotechnology (2023) (duet multiomics solution technology paper).
- Single-cell DNA methylome and 3D multi-omic atlas of the adult mouse brain, Liu, H. et al., Nature (2023).
- Fast, sensitive, and accurate integration of single cell data with Harmony, Korsunsky, I. et al., Nature Methods (2019).
- A taxonomy of transcriptomic cell types across the isocortex and hippocampal formation, Zizhen, Y. et al., Cell (2021).
- Simultaneous single-cell analysis of 5mC and 5hmC with SIMPLE-seq, Bai, D. et al., Nature Biotechnology (2024)
