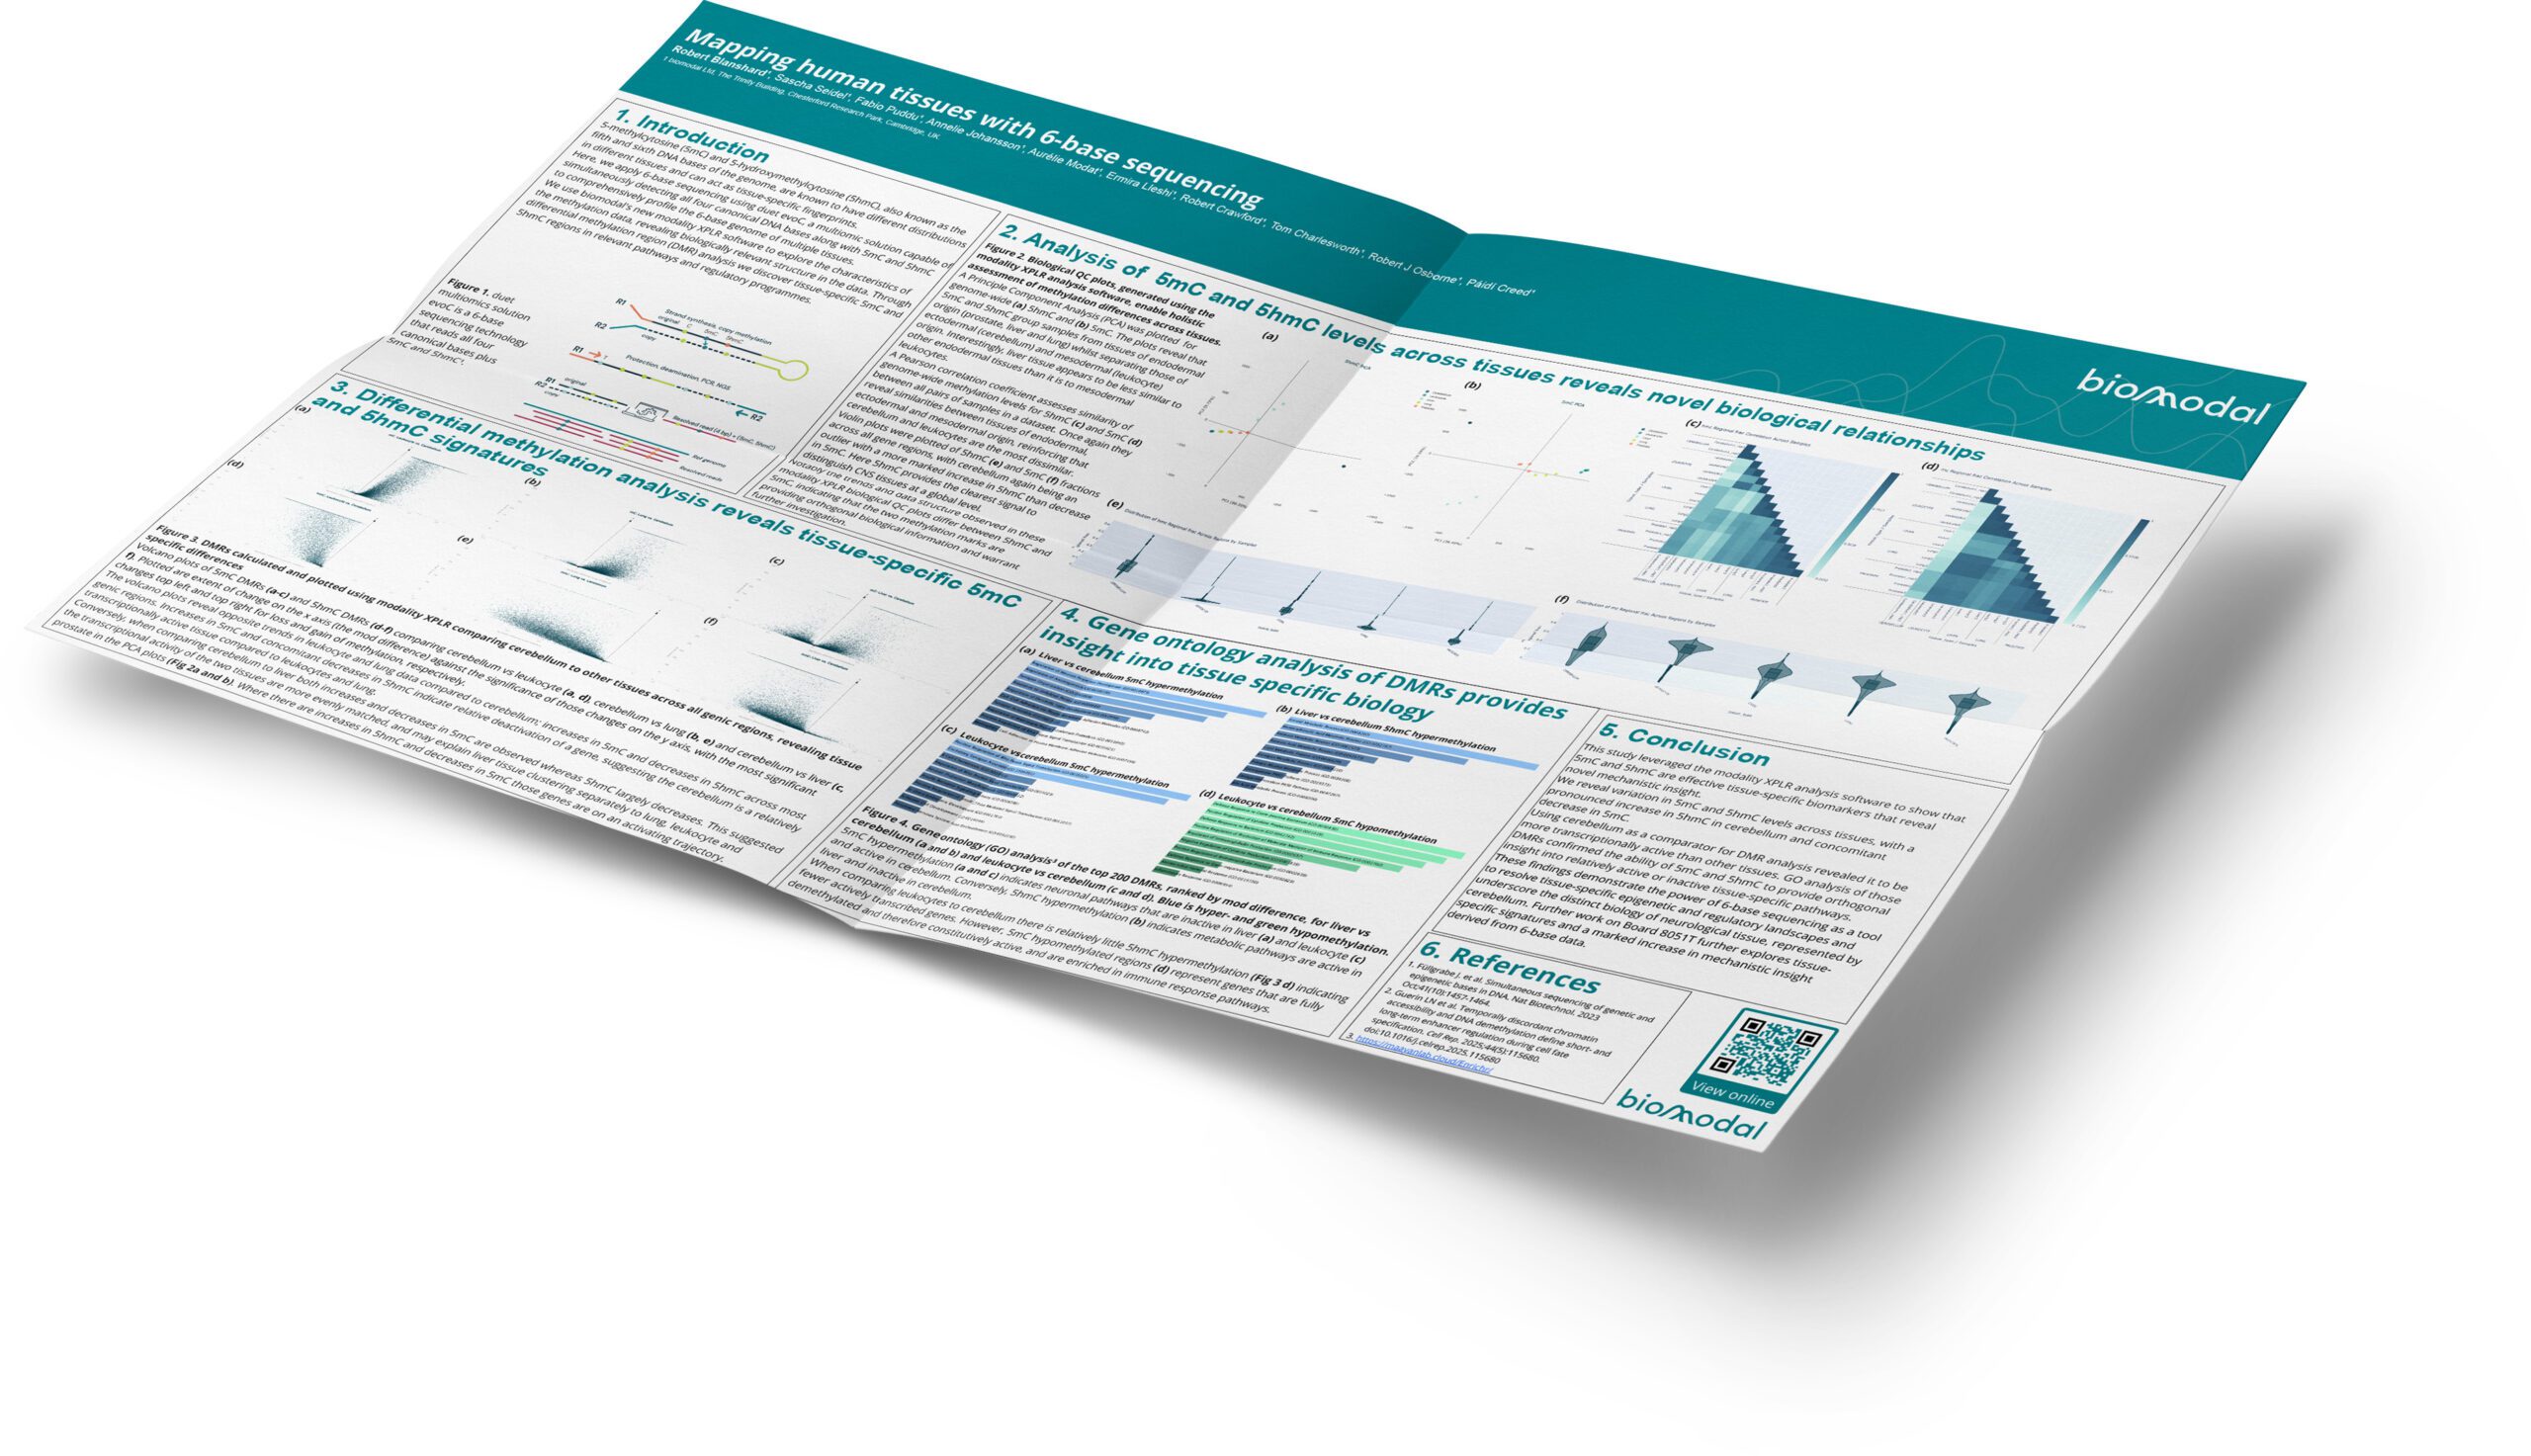
5-methylcytosine (5mC) and 5-hydroxymethylcytosine (5hmC), also known as the fifth and sixth DNA bases of the genome, are known to have different distributions in different tissues and can act as tissue-specific fingerprints.
Here, we apply 6-base sequencing using duet evoC, a multiomic solution capable of simultaneously detecting all four canonical DNA bases along with 5mC and 5hmC to comprehensively profile the 6-base genome of multiple tissues.
We use biomodal’s new modality XPLR software to explore the characteristics of the methylation data, revealing biologically relevant structure in the data. Through differential methylation region (DMR) analysis we discover tissue-specific 5mC and 5hmC regions in relevant pathways and regulatory programmes.

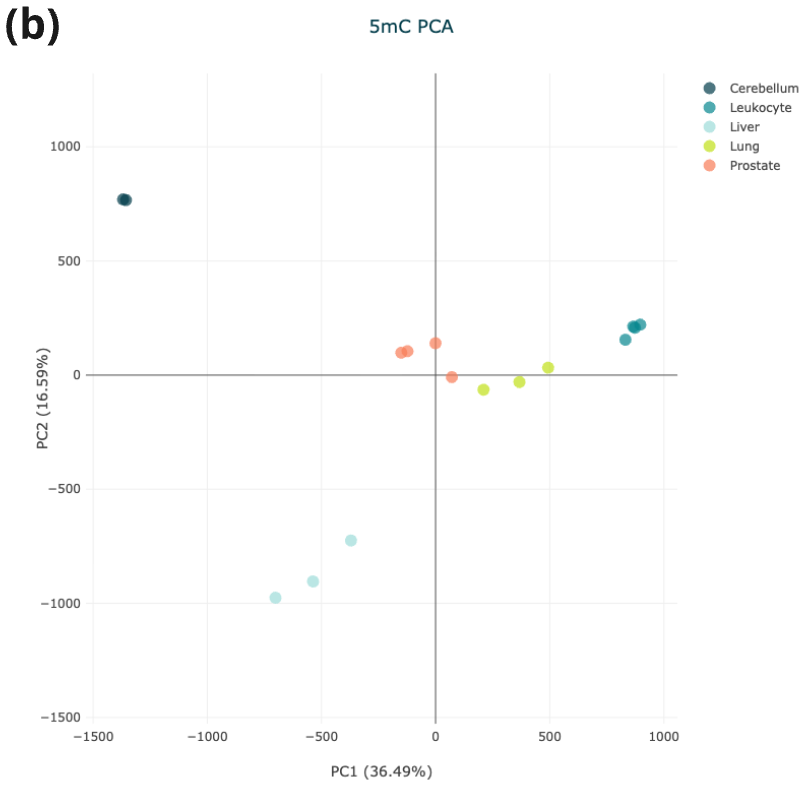
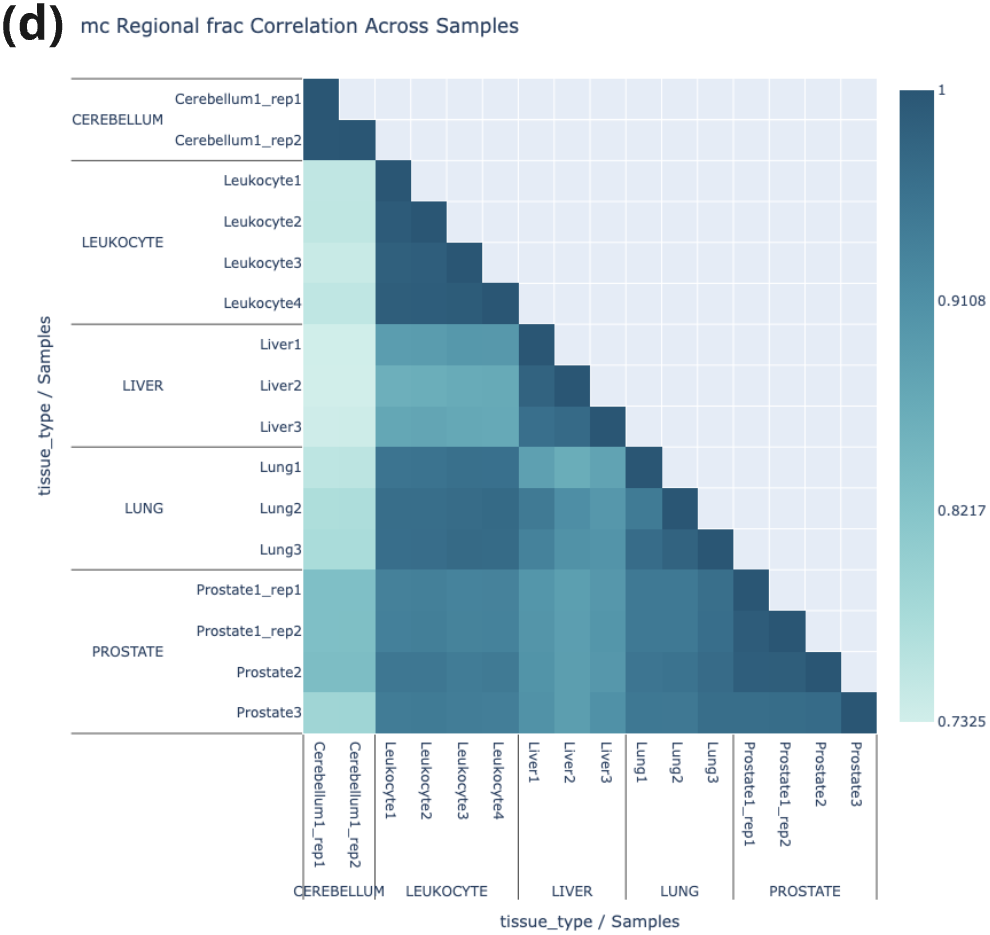


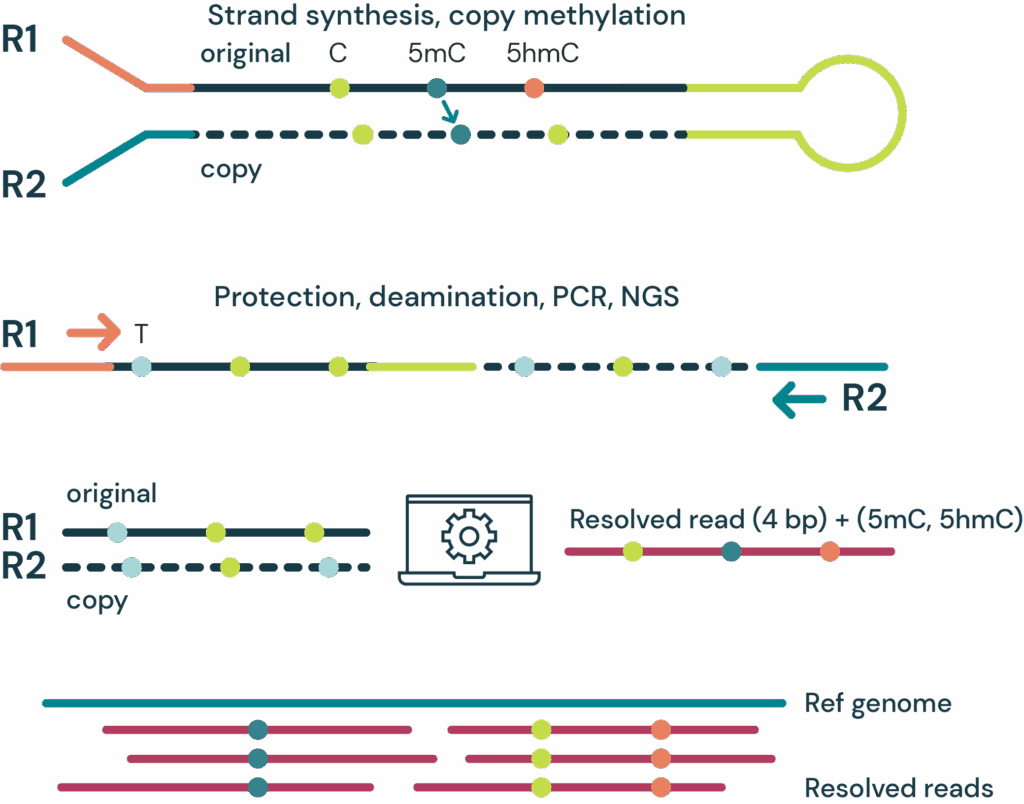
Figure 2: Biological QC plots, generated using the modality XPLR analysis software, enable holistic assessment of methylation differences across tissues.
A Principle Component Analysis (PCA) was plotted for genome-wide (a) 5hmC and (b) 5mC. The plots reveal that 5mC and 5hmC group samples from tissues of endodermal origin (prostate, liver and lung) whilst separating those of ectodermal (cerebellum) and mesodermal (leukocyte) origin. Interestingly, liver tissue appears to be less similar to other endodermal tissues than it is to mesodermal leukocytes.
A Pearson correlation coefficient assesses similarity of genome-wide methylation levels for 5hmC (c) and 5mC (d) between all pairs of samples in a dataset. Once again they reveal similarities between tissues of endodermal, ectodermal and mesodermal origin, reinforcing that cerebellum and leukocytes are the most dissimilar.
Violin plots were plotted of 5hmC (e) and 5mC (f) fractions across all gene regions, with cerebellum again being an outlier with a more marked increase in 5hmC than decrease in 5mC. Here 5hmC provides the clearest signal to distinguish CNS tissues at a global level.
Notably the trends and data structure observed in these modality XPLR biological QC plots differ between 5hmC and 5mC, indicating that the two methylation marks are providing orthogonal biological information and warrant further investigation.
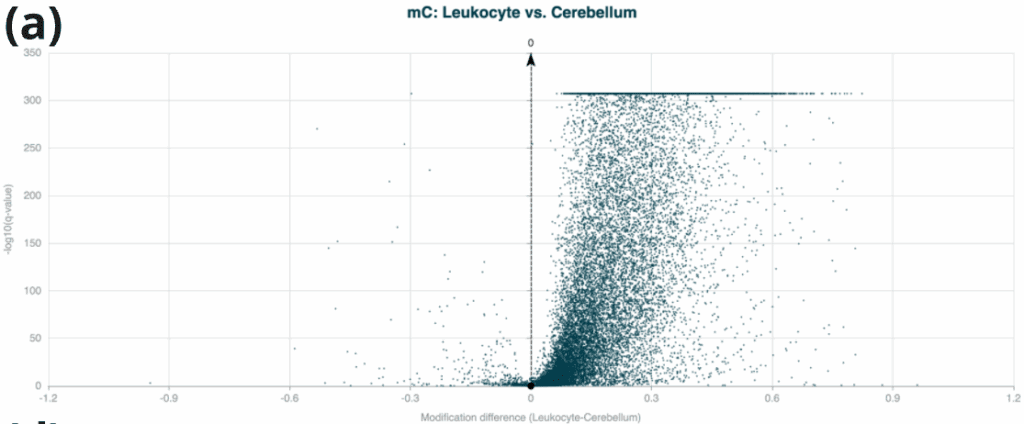
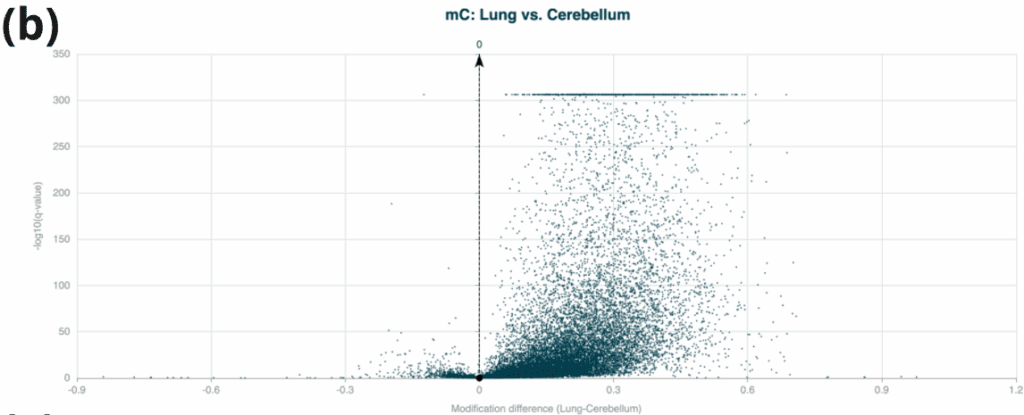
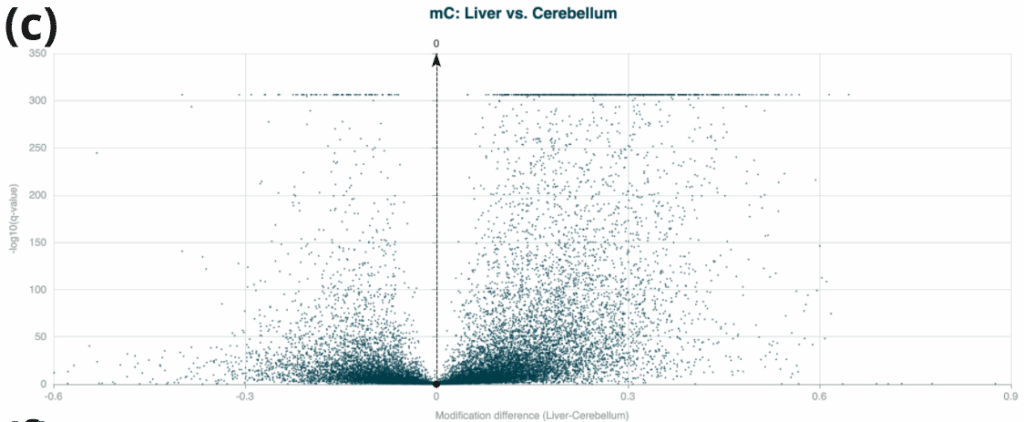


Figure 3: DMRs calculated and plotted using modality XPLR comparing cerebellum to other tissues across all genic regions, revealing tissue specific differences.
Volcano plots of 5mC DMRs (a-c) and 5hmC DMRs (d-f) comparing cerebellum vs leukocyte (a, d), cerebellum vs lung (b, e) and cerebellum vs liver (c, f). Plotted are extent of change on the x axis (the mod difference) against the significance of those changes on the y axis, with the most significant changes top left and top right for loss and gain of methylation, respectively.
The volcano plots reveal opposite trends in leukocyte and lung data compared to cerebellum; increases in 5mC and decreases in 5hmC across most genic regions. Increases in 5mC and concomitant decreases in 5hmC indicate relative deactivation of a gene, suggesting the cerebellum is a relatively transcriptionally active tissue compared to leukocytes and lung.
Conversely, when comparing cerebellum to liver both increases and decreases in 5mC are observed whereas 5hmC largely decreases. This suggested the transcriptional activity of the two tissues are more evenly matched, and may explain liver tissue clustering separately to lung, leukocyte and prostate in the PCA plots (Fig 2a and b). Where there are increases in 5hmC and decreases in 5mC those genes are on an activating trajectory.
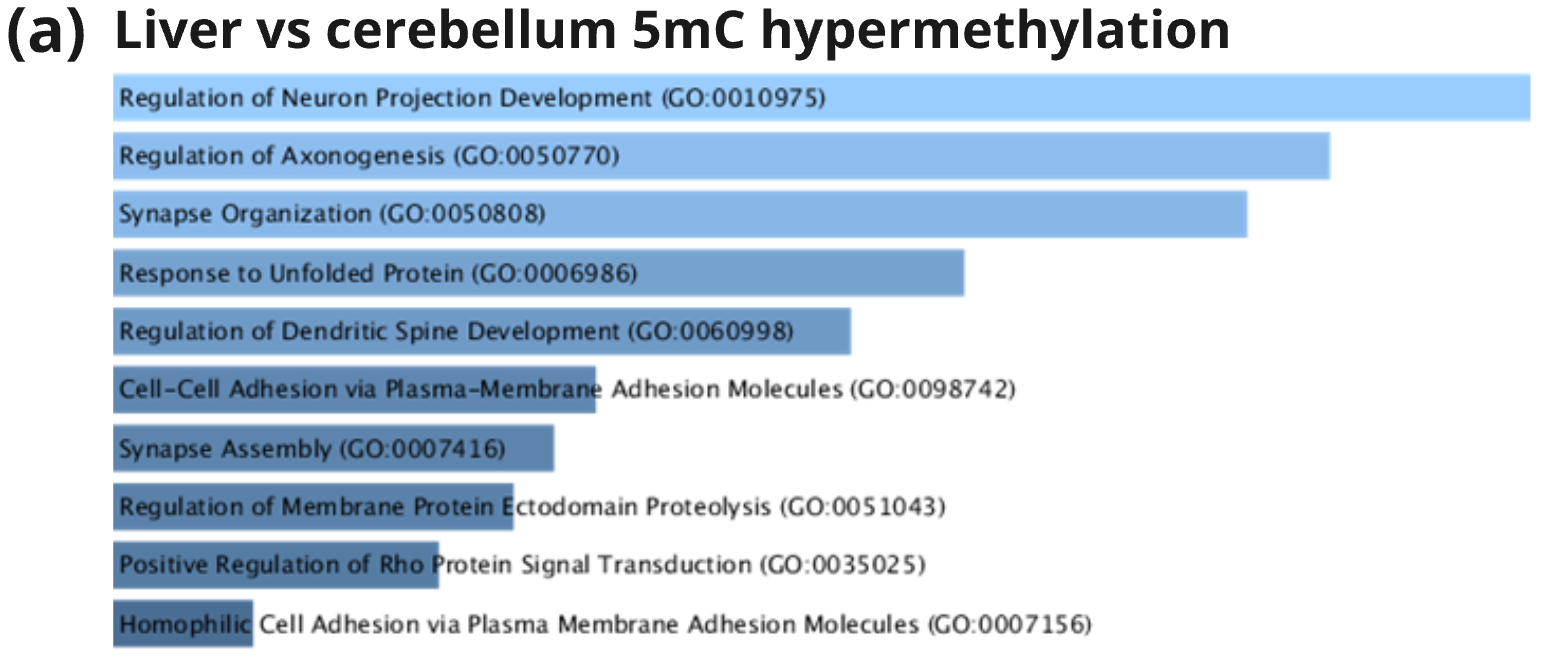
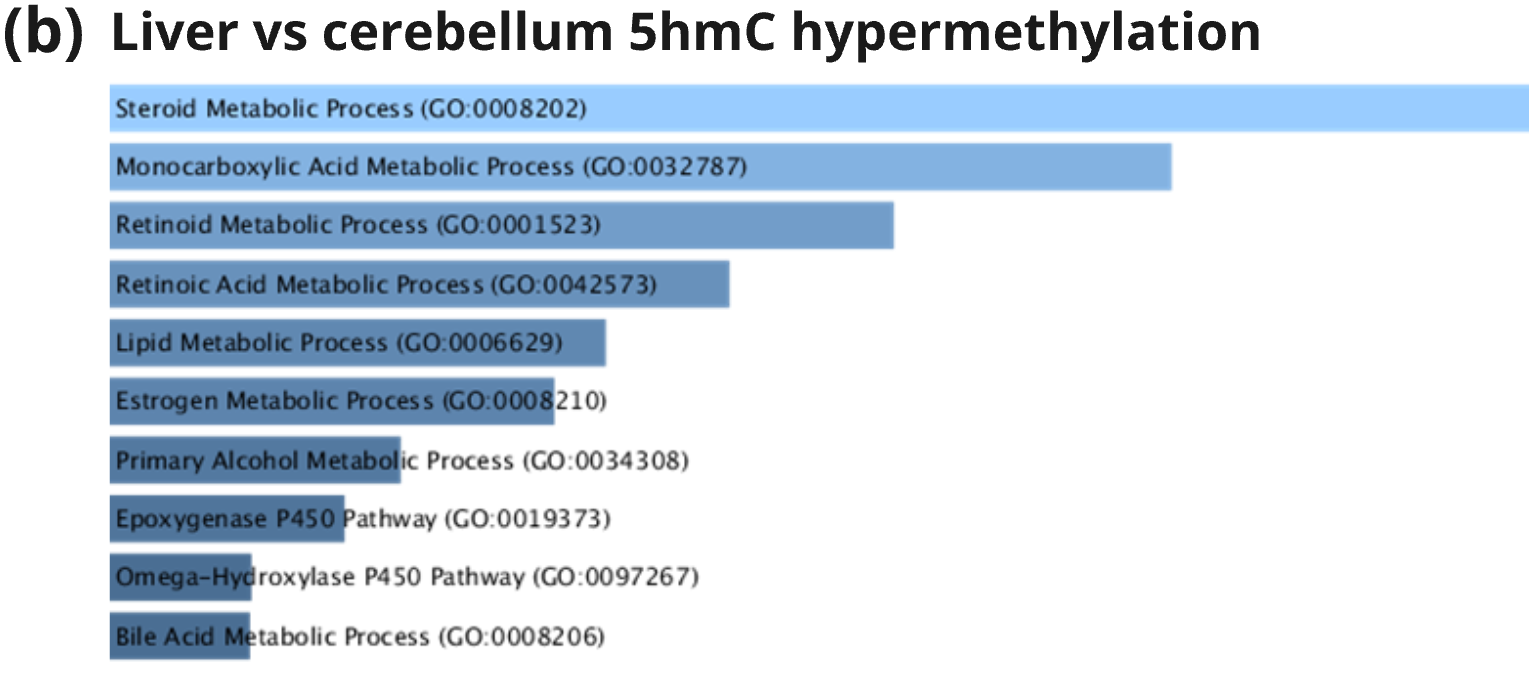

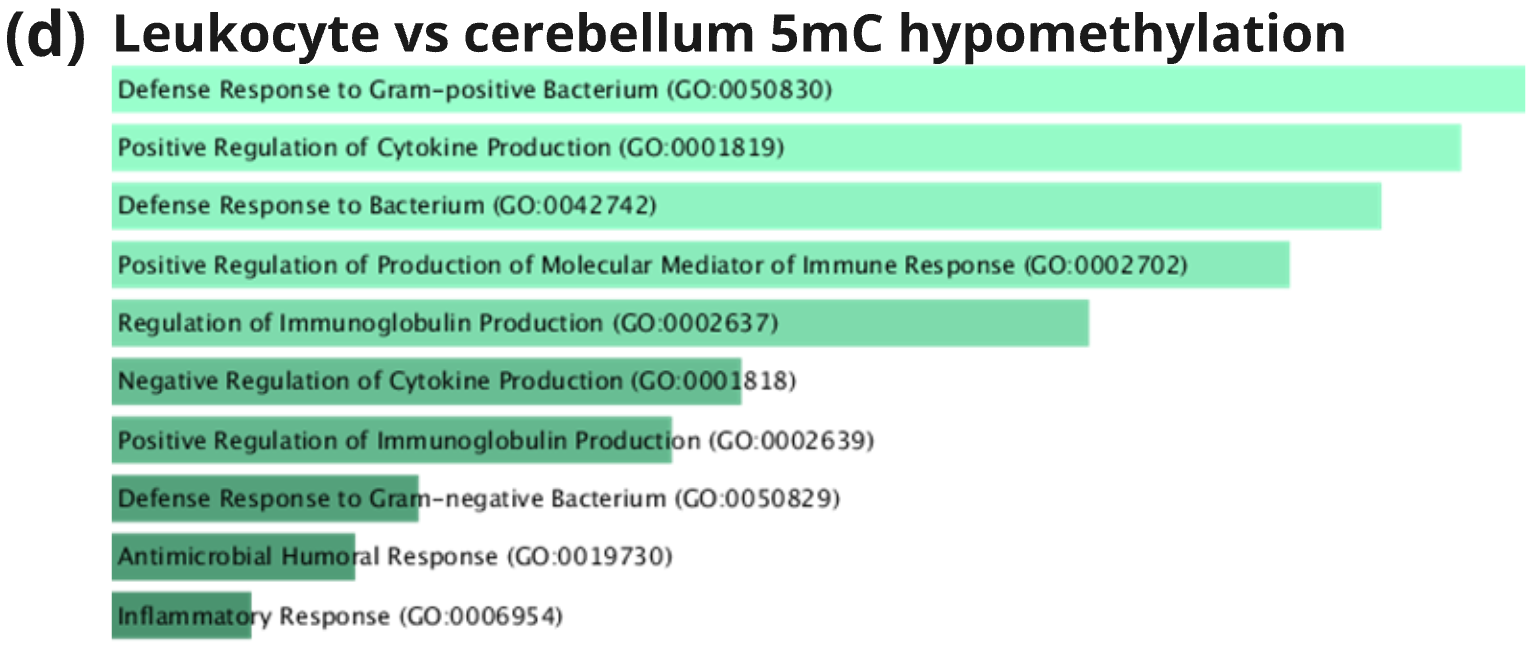
Figure 4: Gene ontology (GO) analysis³ of the top 200 DMRs, ranked by mod difference, for liver vs cerebellum (a and b) and leukocyte vs cerebellum (c and d). Blue is hyper- and green hypomethylation.
5mC hypermethylation (a and c) indicates neuronal pathways that are inactive in liver (a) and leukocyte (c) and active in cerebellum. Conversely, 5hmC hypermethylation (b) indicates metabolic pathways are active in liver and inactive in cerebellum.
When comparing leukocytes to cerebellum there is relatively little 5hmC hypermethylation (Fig 3 d) indicating fewer actively transcribed genes. However, 5mC hypomethylated regions (d) represent genes that are fully demethylated and therefore constitutively active, and are enriched in immune response pathways.
This study leveraged the modality XPLR analysis software to show that 5mC and 5hmC are effective tissue-specific biomarkers that reveal novel mechanistic insight.
We reveal variation in 5mC and 5hmC levels across tissues, with a pronounced increase in 5hmC in cerebellum and concomitant decrease in 5mC.
Using cerebellum as a comparator for DMR analysis revealed it to be more transcriptionally active than other tissues. GO analysis of those DMRs confirmed the ability of 5mC and 5hmC to provide orthogonal insight into relatively active or inactive tissue-specific pathways.
These findings demonstrate the power of 6-base sequencing as a tool to resolve tissue-specific epigenetic and regulatory landscapes and underscore the distinct biology of neurological tissue, represented by cerebellum. Further work on Board 8051T further explores tissue-specific signatures and a marked increase in mechanistic insight derived from 6-base data.
- Füllgrabe J. et al. Simultaneous sequencing of genetic and epigenetic bases in DNA. Nat Biotechnol. 2023 Oct;41(10):1457-1464.
- Guerin LN et al. Temporally discordant chromatin accessibility and DNA demethylation define short- and long-term enhancer regulation during cell fate specification. Cell Rep. 2025;44(5):115680. doi:10.1016/j.celrep.2025.115680
- https://maayanlab.cloud/Enrichr/
